
Overview
UnifyApps' OpenTelemetry feature enables users to publish telemetry metrics to Prometheus, allowing for enhanced analytics and logging of platform features. These metrics provide valuable insights into the performance and behavior of key platform components, supporting better monitoring, debugging, and decision-making processes.
.png&w=1080&q=75&dpl=dpl_5H5sj51KgVz3D2yHXDGeMZK5v5yJ)
.png)
Telemetry metrics can be published across the following three asset classes:
Automations: Metrics can be configured at various levels, including:Node Level: Metrics for individual node performance.
Individual Automation Level: Metrics for specific automations.
Global Automation Level: Metrics for all automations across the platform.
Connections: Metrics can be published at:Individual Connection Level: Metrics for specific connections.
Global Connections Level: Metrics for all connections on the platform.
APIs: Metrics can be configured at:API Group Level: Metrics for specific API groups.
Global APIs Level: Metrics for all APIs on the platform.
These published metrics are logged in the Prometheus account linked to the relevant environment, enabling platform administrators to monitor system performance and usage at varying levels of granularity.
.png&w=1080&q=75&dpl=dpl_5H5sj51KgVz3D2yHXDGeMZK5v5yJ)
.png)
Key Features of Telemetry in UnifyApps
Metric Formats:Metrics can be configured in two formats:
Counter: Tracks the number of occurrences for a specific action or event.
Timer: Measures the time taken for a specific action or event.
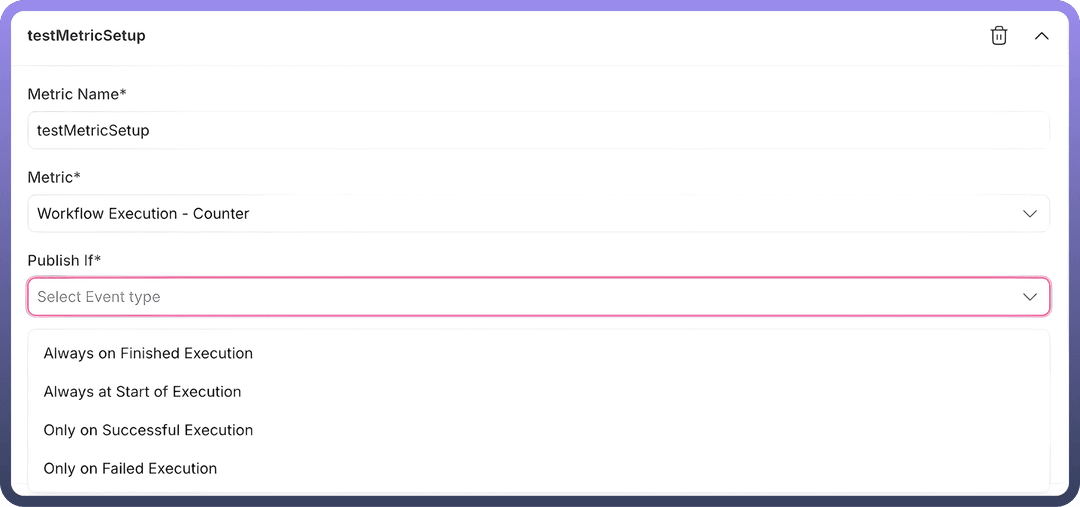
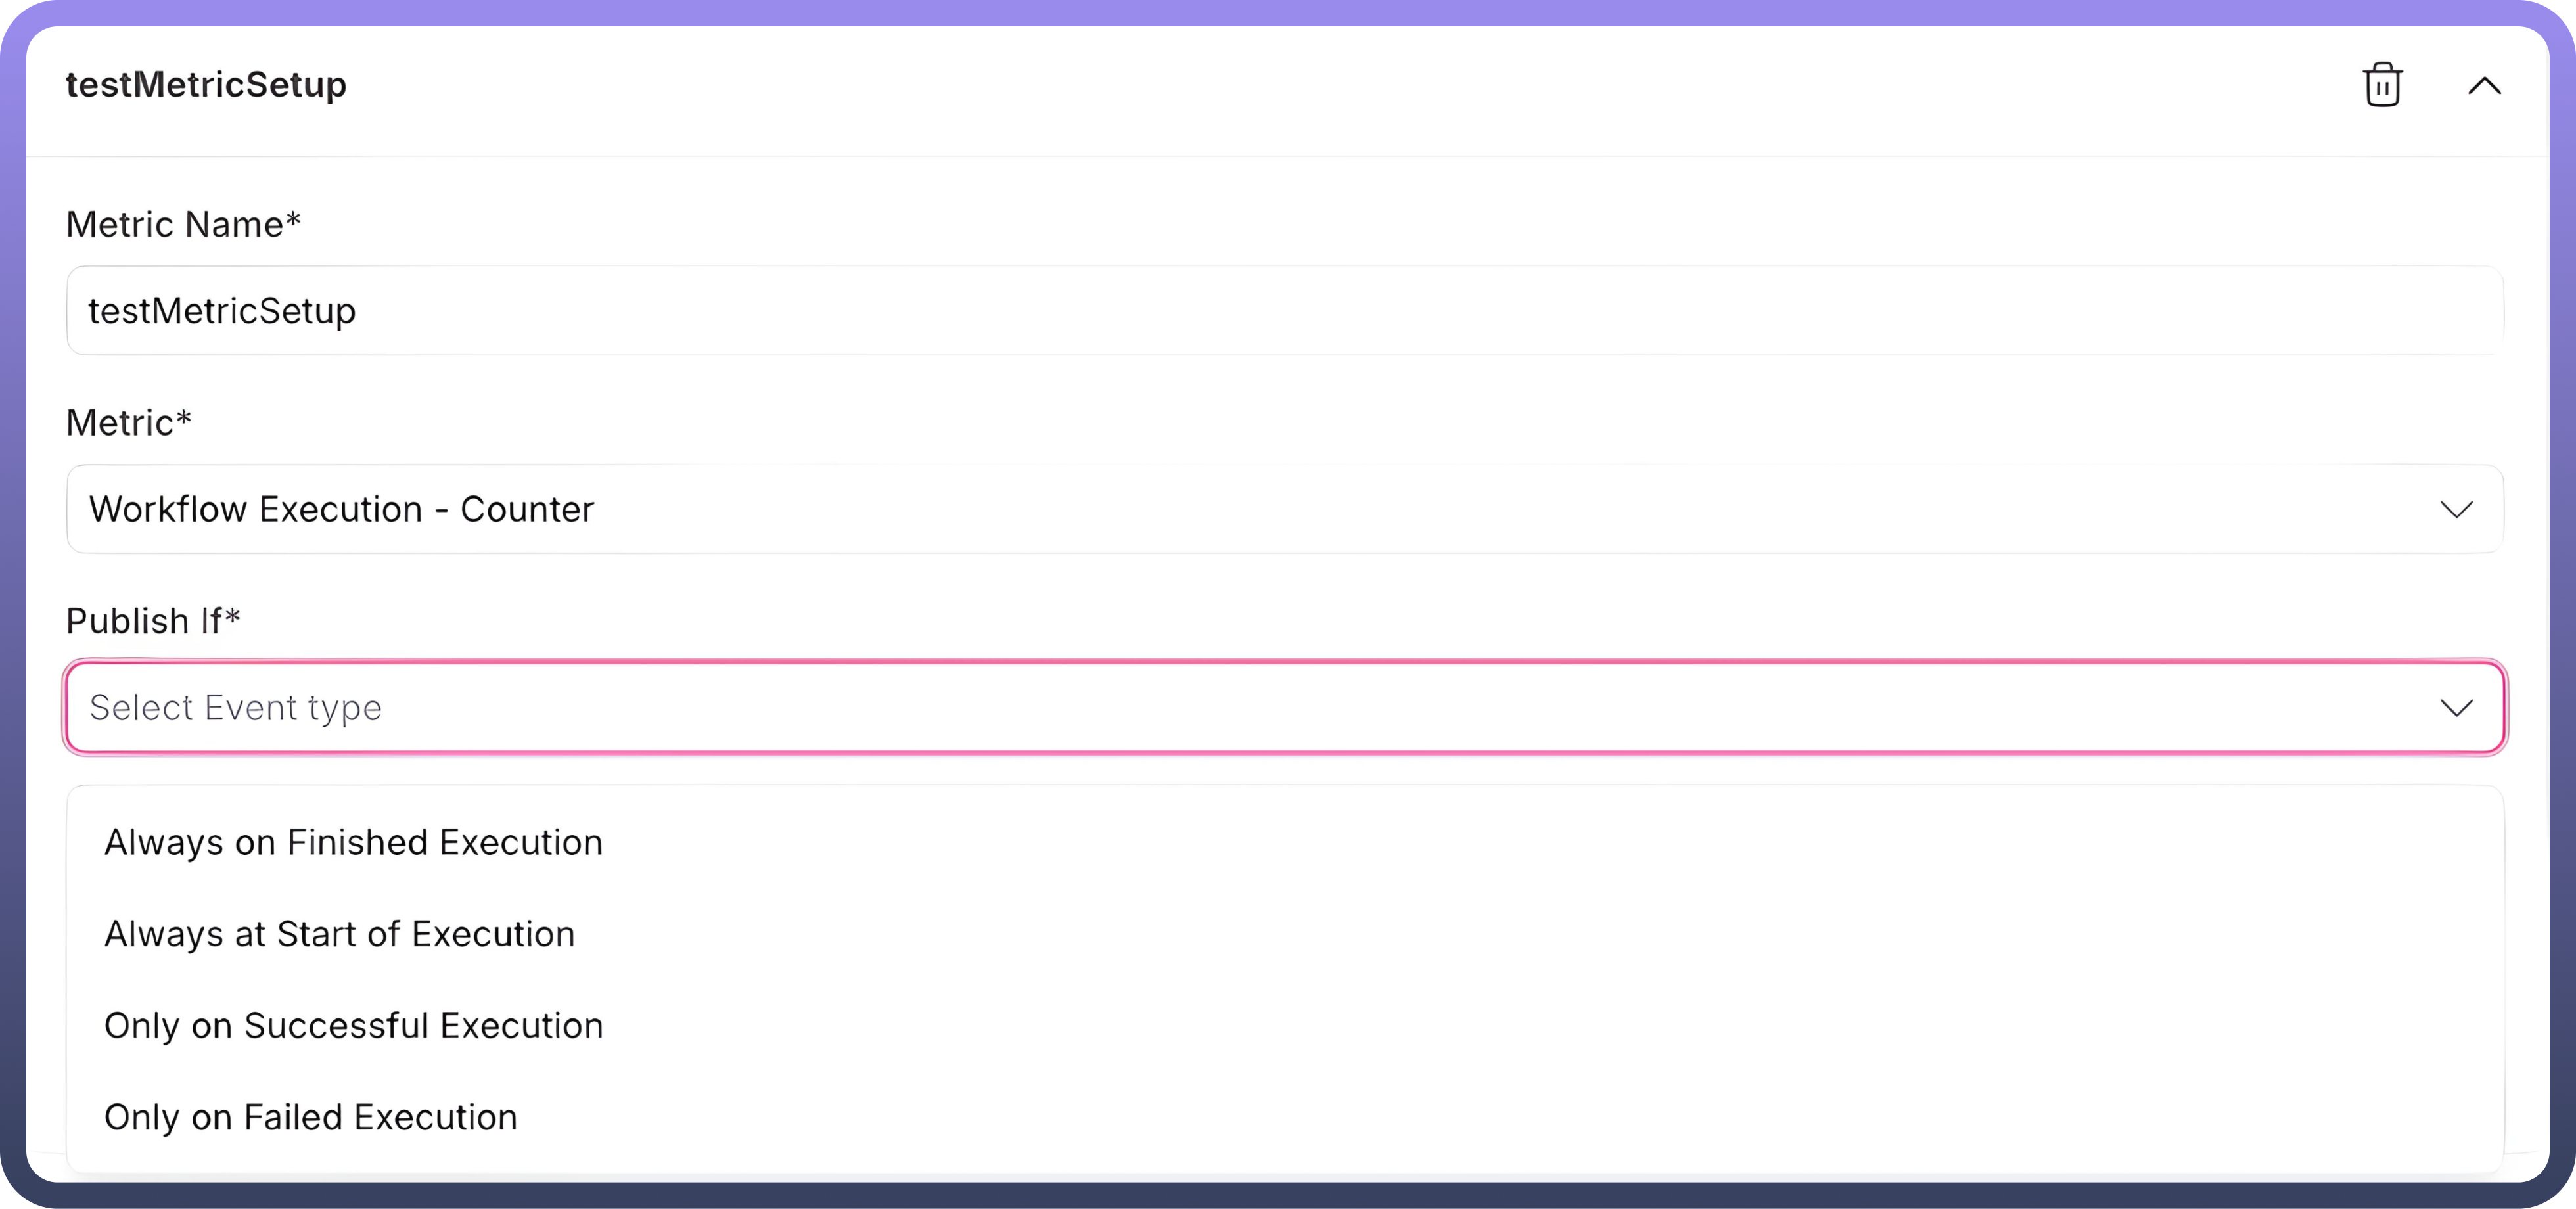
Publish Situations:Metrics can be configured to publish for different events across the asset classes
For Automations:
Always on Finished Execution: Metrics are published after the completion of an execution, regardless of its outcome.
Always at Start of Execution: Metrics are published at the beginning of an execution.
Only on Successful Execution: Metrics are published only when the execution is completed successfully.
Only on Failed Execution: Metrics are published only when the execution fails.
For Connections:
Always: Metrics are published for every connection event.
On Successful Events: Metrics are published when a connection event succeeds.
On Error Events: Metrics are published when a connection event encounters an error.
For APIs:
Always: Metrics are published for every API event.
On Successful Events: Metrics are published when an API call succeeds.
On Failure Events: Metrics are published when an API call fails.
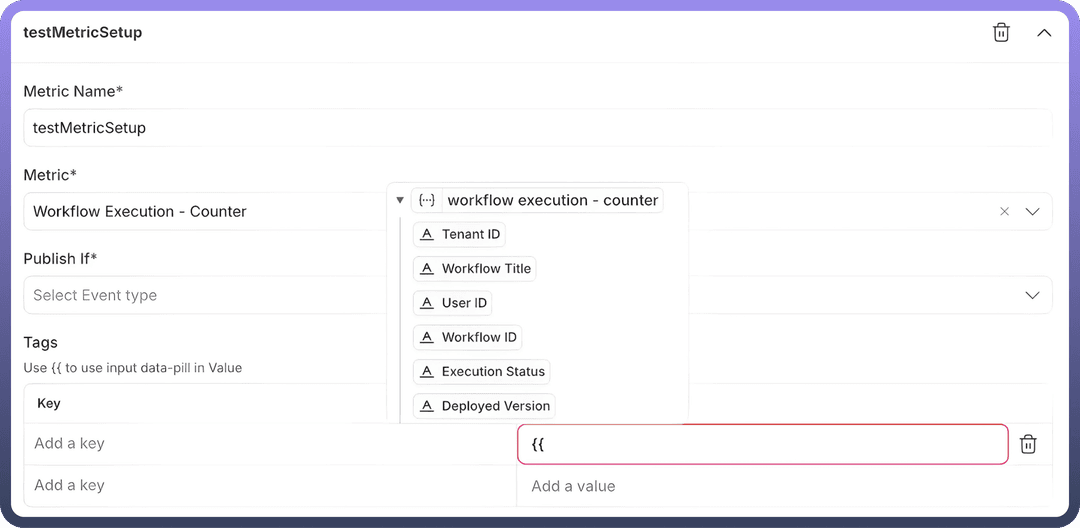
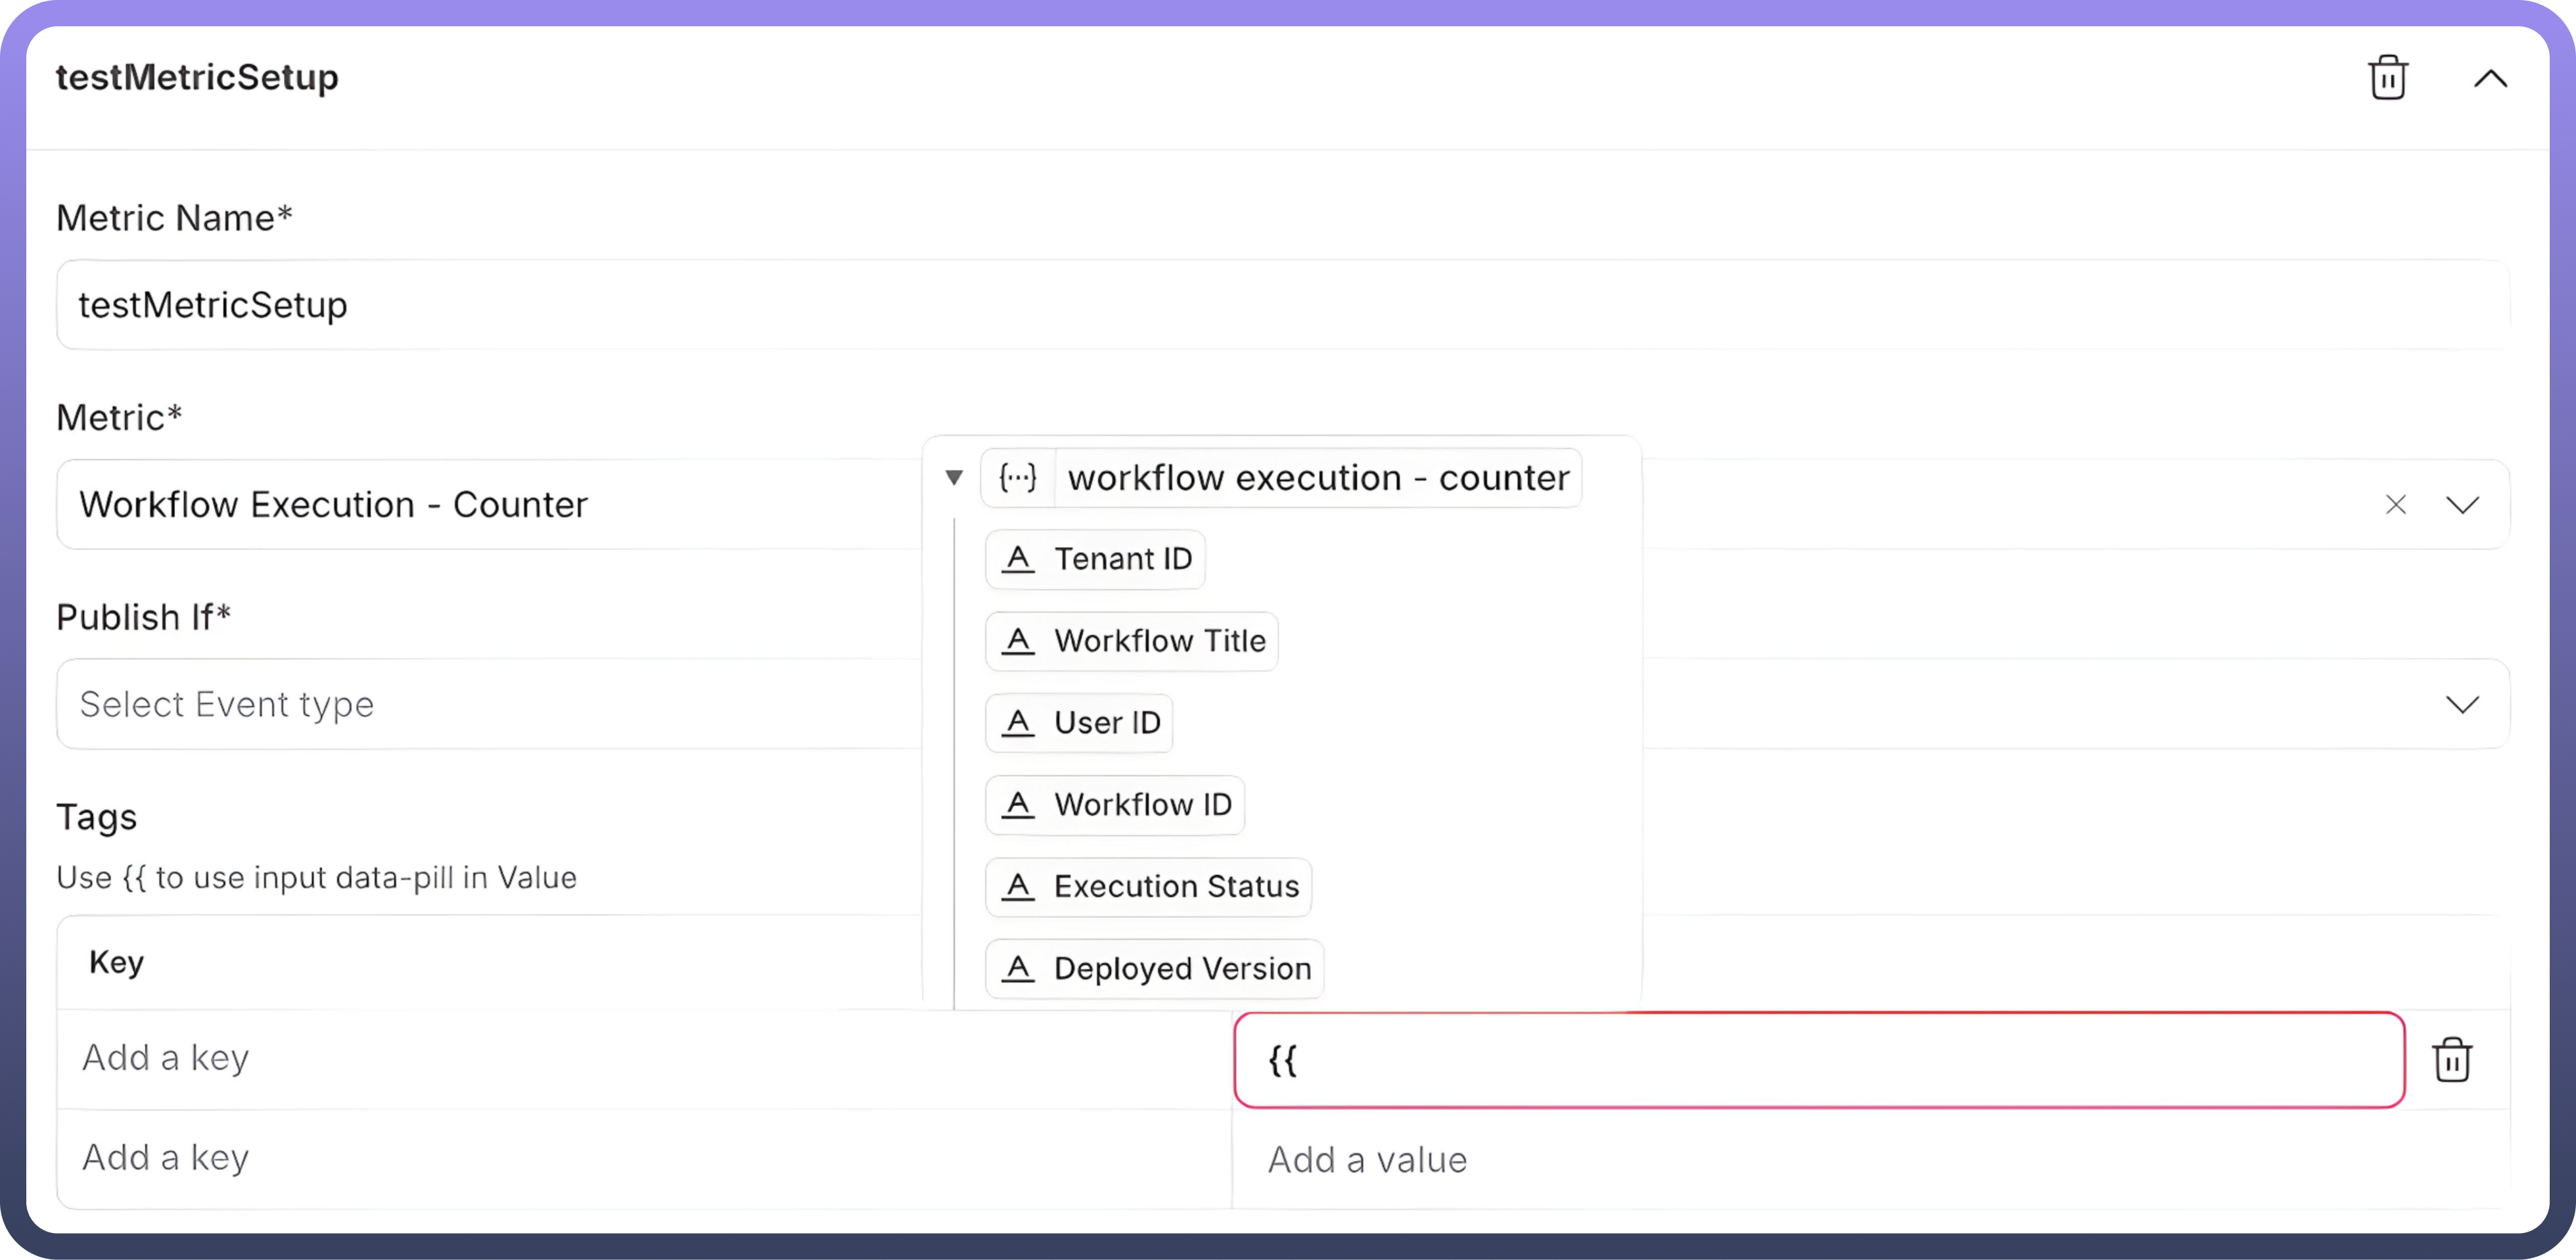
Tags:Users can configure key-value pairs corresponding to the asset class, allowing customization of logged data.
As shown in the screenshot:
Tags can be added as keys, and values are logged for each event.
Datapills can be mapped to keys, passing dynamic values to the log for every event. This enables differentiation between events and provides detailed insights into the event logs.
Available tags-values corresponding to the asset classes:
| Asset Class | Level | Fields Available |
1. Automations | Node Level | App Name, Tenant Id, Workflow Title, Resource Name, User Id, Node Id, Workflow Id, Execution Status, Deployed Version |
| Automation Level | Tenant Id, Workflow Title, User Id, Workflow Id, Execution Status, Deployed Version | |
| Global Level | Tenant Id, Workflow Title, User Id, Workflow Id, Execution Status, Deployed Version | |
2. Connections | Connection Level | App Name, Connection Id, Resource Name, Connection Name, Outcome |
| Global Level | App Name, Connection Id, Resource Name, Connection Name, Outcome | |
3. APIs | API Group | Collection Path, Endpoint Id, Http Method, User Id, API Path, Http Status, Tenant Id, Host, Cache Hit, API Client Id, Auth Type, Collection Id, Outcome |
| Global Level | Collection Path, Endpoint Id, Http Method, User Id, API Path, Http Status, Tenant Id, Host, Cache Hit, API Client Id, Auth Type, Collection Id, Outcome |
Implementation Details

Metrics Architecture
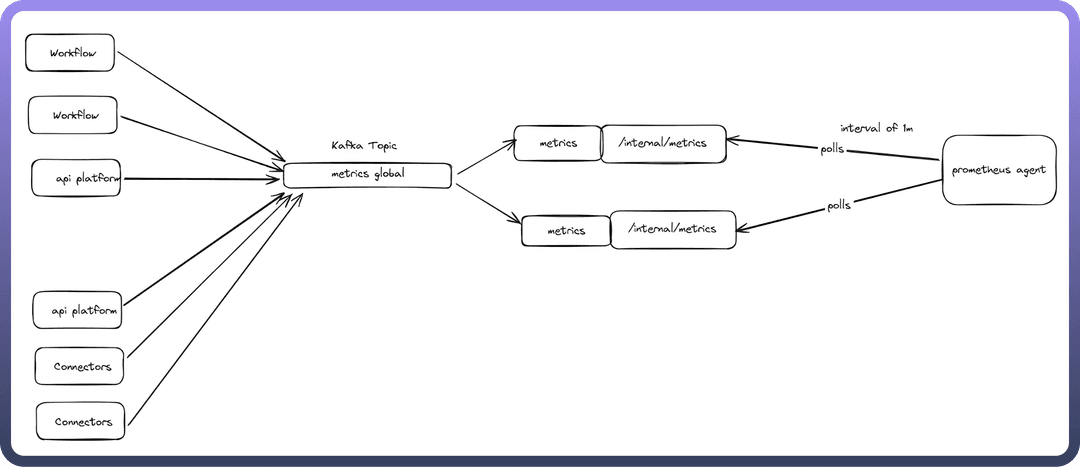
Data Flow
Applications (workflow, api-platform, connectors) → metrics Kafka topic
Events are micro-batched for efficiency with minimal delays
Metrics Consumer reads Kafka topic → exposes Prometheus metrics via internal/metrics
Prometheus agent scrapes metrics from all application pods
Why Centralized Metrics?
Instead of direct Prometheus exposure from each app, we use a dedicated metrics service because:
Protects core apps from memory issues
Handles user-configurable tags that cause high cardinality
Prevents OOM crashes by isolating Micrometer's memory-intensive tag caching.